निर्देश (81-85) : प्रश्न दिए गए ग्राफ पर आधारित हैं । इन प्रश्नों के उत्तर दें।
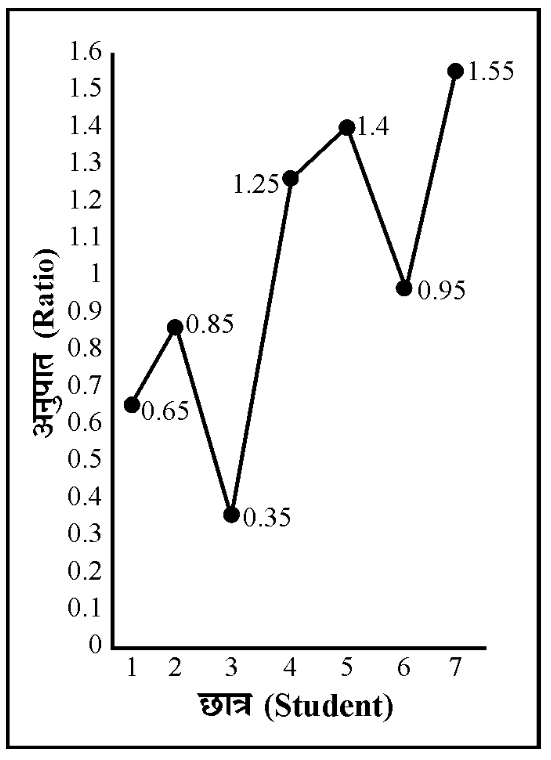
Directions (81-85) : The questions are based on the below shown graph. Answer these questions. ग्राफ में एक परीक्षा में 7 छात्रों के इतिहास और भूगोल के अंकों का अनुपात दर्शाया गया है । The graph shows the ratio of marks of History to Geography of 7 students in an examination.

कितने छात्रों ने भूगोल की अपेक्षा इतिहास में ज्यादा अंक अर्जित किए ?
How many students got more marks in History than in Geography ?
(A) 2
(B) 3
(C) 4
(D) 5
Answer – B
निम्न में से किन छात्रों को भूगोल की अपेक्षा इतिहास में कम अंक मिले ?
Which of the following students got less marks in History than in Geography ?
(A) 1, 3, 5, 6
(B) 1, 2, 3, 6
(C) 1, 4, 5, 7
(D) 4, 5, 7 |
Answer – B
भूगोल में छात्र 3 से 4 के मध्य अंक की प्रतिशत बढ़त है –
Percentage increase of marks in Geography from student 3 to 4 is –
(A) 15
(B) 20
(C) 90
(D) आँकड़े अपर्याप्त/Insufficient data
Answer – D
इतिहास/भूगोल के अधिकतम अनुपात और न्यूनतम अनुपात का अंतर है
The difference of the maximum ratio and minimum ratio of History/Geography is
(A) 0.45
(B) 0.50
(C) 0.90
(D) 1.20
Answer – D
छात्र 4 को भूगोल में 60 अंक मिले। उसके इतिहास में अंक हैं –
Student 4 got 60 marks in Geography. His marks in History are –
(A) 48
(B) 68
(C) 75
(D) इनमें से कोई नहीं/ None of these
Answer – C
निर्देश (86-90) : ग्राफ का अध्ययन कर निम्नलिखित प्रश्नों के उत्तर देवें :
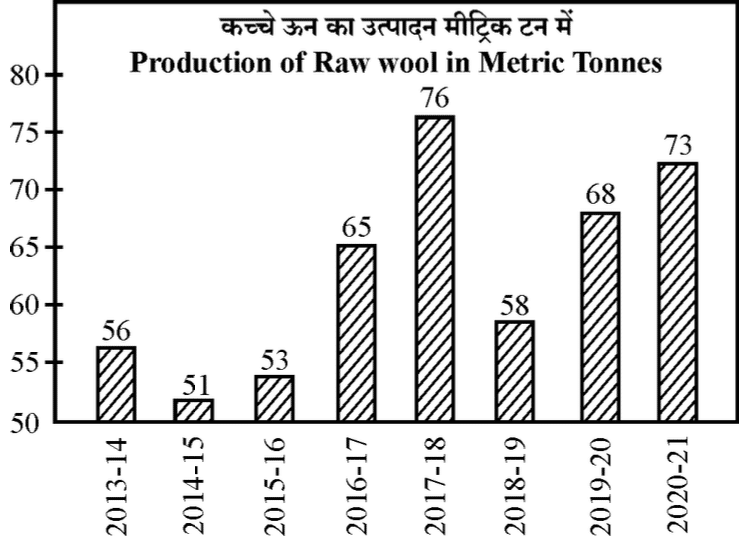
Directions (86-90) : Study the graph and answer the following questions :
कच्चे ऊन के उत्पादन में उच्चतम वृद्धि का वर्ष था :
The maximum rise in the production of raw wool was in the year :

(A) 2017-18
(B) 2020-21
(C) 2016-17
(D) 2019-20
Answer – C
पहले चार वर्षों के उत्पादन की तुलना में अन्तिम चार वर्षों में कच्चे ऊन का उत्पादन _% बढ़ गया। During the last four years the production of raw wool increased by % on the production of the first four years.
(A) 26.8
(B) 22.2
(C) 19.8
(D) 25.0
Answer – B
आठ वर्षों के दौरान औसत उत्पादन था
The average production during the eight years was
(A) 67.2 MT
(B) 62.5 MT
(C) 50.0 MT
(D) 52.8 MT
Answer – B
उत्पादन में पिछले वर्ष की तुलना में अधिकतम प्रतिशत घटत किस वर्ष रही ?
The maximum percentage decrease of production over the previous year was in the year :
(A) 2018-19
(B) 2017-18
(C) 2013-14
(D) 2014-15
Answer – A
2014-15 में कच्चे ऊन का उत्पादन 2019-20 के उत्पादन का था। The production of raw wool in 2014-15 was _ of the production in 2019-20.
(A) ⅓
(B) ⅔
(C) ½
(D) ¾
Answer – D
निर्देश (91-95) : दी गई तालिका के आधार पर निम्नलिखित प्रश्नों के उत्तर दीजिए :
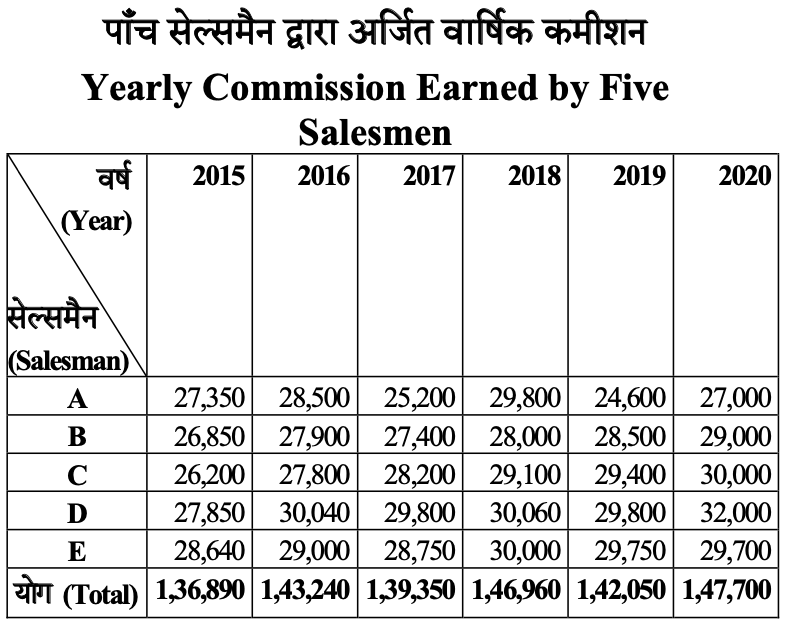
Directions (91-95) : Read the following table and answer the questions given below it.

किस वर्ष में सेल्समैन C द्वारा अर्जित कमीशन पिछले वर्ष की तुलना में अधिकतम वृद्धि दर्शाता है ?
In which year commission earned by the salesman C showed the highest increase that of the preceding year?
(A) 2016
(B) 2017
(C) 2018
(D) 2019
Answer – A
वर्ष 2018 में B का कमीशन पाँचों सेल्समैनों के उसी वर्ष के कुल कमीशन का लगभग कितना प्रतिशत था ?
In the year 2018 the commission of B was approximately what percent of the total commission earned by all salesmen in that year?
(A) 19.05
(B) 98
(C) 80
(D) इनमें से कोई नहीं/None of these
Answer – A
किस सेल्समैन का 2018 में कमीशन, 2015 की तुलना में उच्चतम वृद्धि दर्शाता है ?
Which salesman’s commission in 2018 show the highest increase over that in 2015 ?
(A) A
(B) B
(C) D
(D) C
Answer – D
निम्न में से किस वर्ष में किसी भी सेल्समैन द्वारा अर्जित उच्चतम और न्यूनतम कमीशन का अंतर अधिकतम है ?
In which of the following year was the difference between the highest and lowest commission earned by any salesman maximum ?
(A) 2017
(B) 2018
(C) 2019
(D) 2020
Answer – C
वर्ष 2019 में सेल्समैन D द्वारा अर्जित कमीशन A द्वारा अर्जित कमीशन का लगभग कितना प्रतिशत है ?
In the year 2019, commission earned by salesman D was approximately what percent of commission earned by A?
(A) 18
(B) 21
(C) 52
(D) इनमें से कोई नहीं/None of these
Answer – D
निर्देश (96-100) : दी गई तालिका/सारणी का ध्यानपूर्वक अध्ययन करें तथा नीचे दिए प्रश्नों के उत्तर दें :
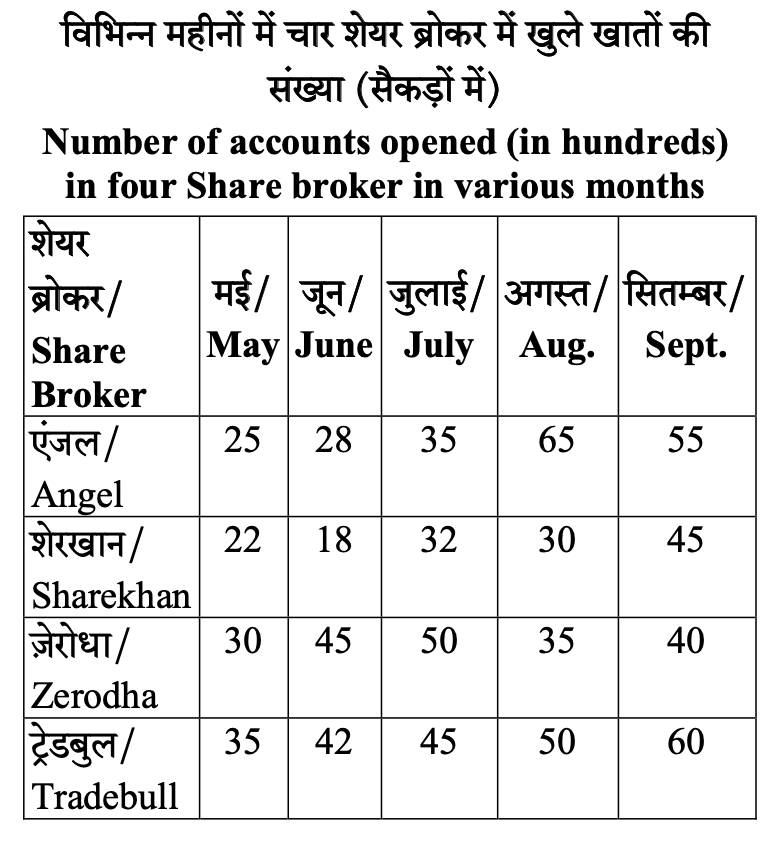
Directions (96-100) : Study the table and answer the questions given below :

निम्नलिखित में से किस महीने में खुले खातों की संख्या की औसत महत्तम है ?
(A) जून
(B) सितम्बर
(C) अगस्त
(D) मई
In which of the following months is the average of the number of opened accounts the maximum ?
(A) June
(B) September
(C) August
(D) May
Answer – B
अगस्त में खुले खातों की संख्या जून में खुले खातों की संख्या से लगभग कितने प्रतिशत कम या ज्यादा थी ?
The number of accounts opened in Aug. is approximately what percent more or less than the number of accounts opened in June ?
(A) 33.5
(B) 35.3
(C) 34.6
(D) 40
Answer – B
मई से सितम्बर तक एंजल में खुले खातों की संख्या से ज़ेरोधा में खुले खातों की संख्या का अनुपात क्या है ?
What is the ratio of the number of accounts opened in Angel to that opened in Zerodha from May to September ?
(A) 1.5
(B) 0.75
(C) 2.25
(D) 1.04
Answer – D
किस शेयर ब्रोकर में खुले खातों की औसत संख्या महत्तम है ?
(A) एंजल
(B) शेरखान
(C) ट्रेडबुल
(D) ज़ेरोधा
In which Share broker is the average number of accounts opened the maximum ?
(A) Angel
(B) Sharekhan
(C) Tradebull
(D) Zerodha
Answer – C
ट्रेडबुल में खुले खातों की संख्या का औसत शेरखान में खुले खातों की संख्या के औसत का लगभग कितना प्रतिशत कम या ज्यादा था ?
The average number of accounts opened in Tradebull is approximate what percent more or less than the average number of accounts opened in Sharekhan ?
(A) 57.82
(B) 60
(C) 45.90
(D) 50.69
Answer – A