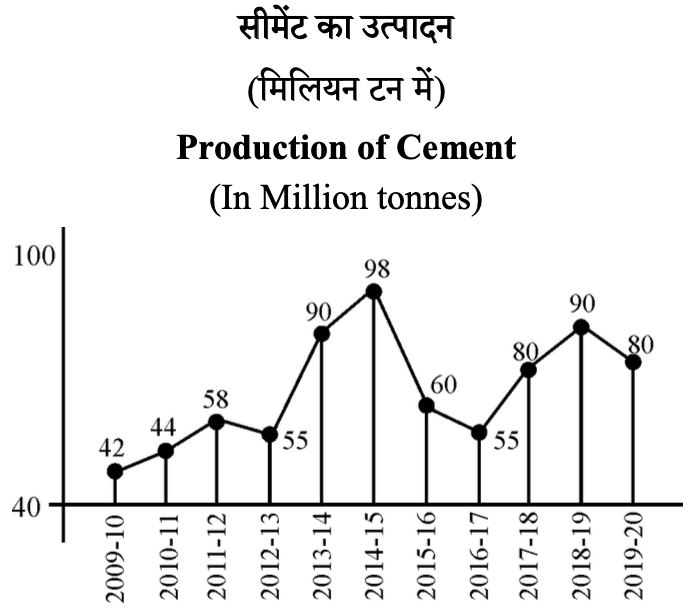
निर्देश (81-85) : निम्नांकित रेखाचित्र में सीमेंट का विभिन्न वर्षों के दौरान उत्पादन (मिलियन टन में) दर्शाया गया है । इसका अध्ययन करें और निम्नलिखित प्रश्नों के उत्तर दीजिए :
Directions (81-85) : The following graph shows the production of cement in Million Tonnes during the various years. Study the same and answer the following questions correctly :

उत्पादन अधिकतम स्तर तक इस वर्ष घटा :
The production fell down to the maximum extent in the year :
(A) 2012-13
(B) 2015-16
(C) 2016-17
(D) 2019-20
Answer – B
उत्पादन में पिछले वर्ष की तुलना में वर्ष _ के दौरान अधिकतम वृद्धि हुई। The increase in production was maximum during the year _ over its previous year.
(A) 2013-14
(B) 2017-18
(C) 2014-15
(D) 2018-19
Answer – A
प्रथम तीन वर्ष दौरान औसत उत्पादन था
The average production during the first three years was :
(A) 44 MT
(B) 46 MT
(C) 48 MT
(D) 50 MT
Answer – C
सीमेंट का अधिकतम उत्पादन दर्ज हुआ इस वर्ष :
The maximum production of cement was noted in the year :
(A) 2013-14
(B) 2014-15
(C) 2018-19
(D) 2017-18
Answer – B
वर्ष 2011-12 के दौरान उत्पादन वृद्धि प्रतिशत पिछले वर्ष की तुलना में था
The percentage increase in production during 2011-12 over its previous year was :
(A) 31.8%
(B) 36%
(C) 37.5%
(D) इनमें से कोई नहीं / None of these
Answer – A
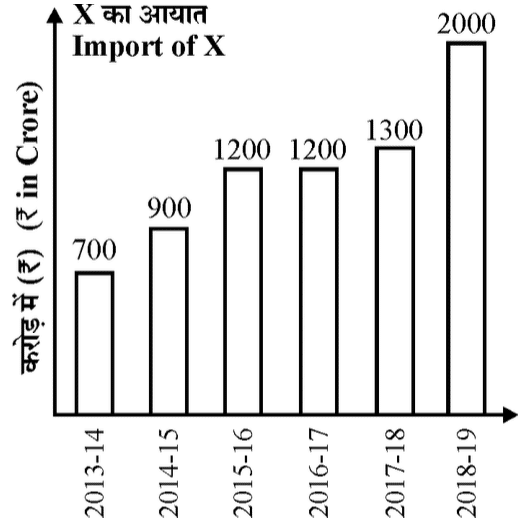
निर्देश (86-90) : दिया गया ग्राफ एक वस्तु X के आयात को 2013 से 2019 के मध्य करोड़ रुपये में दर्शाता है । दर्शाए गए चित्र पर आधारित प्रश्नों के उत्तर दें।
Directions (86-90) : The following graph shows the import of a certain commodity X in Crore Rupees between 2013 and 2019. The questions are based on the shown figure. Answer these questions.

वर्ष 2014-15 से 2015-16 के दौरान X के आयात में वृद्धि प्रतिशत है –
Percent increase in import of X from 2014-15 to 2015-16 is
(A) 43.0%
(B) 33.3%
(C) 28.8%
(D) 25.0%
Answer – B
सभी वर्षों के लिए वर्ष दर वर्ष X के आयात की वृद्धि का औसत (₹ करोड़ में) है
Average of the increase in import of X year by year for all the years is (in ₹ crore)
(A) 260
(B) 280
(C) 325
(D) इनमें से कोई नहीं / None of these
Answer – A
विगत कितने वर्षों तक X का आयात, X के औसत आयात से अधिक था ?
For how many years, there was more import of X, than the average import of X?
(A) 4
(B) 3
(C) 2
(D) 1
Answer – C
X के औसत आयात से अधिक आयात और X के औसत आयात से कम आयात के वर्षों का अंतर है
The difference of the numbers of years in which import of X is less than the average import and in which import of X is more than the average import is
(A) 3
(B) 2
(C) 1
(D) 0
Answer – B
वर्ष 2018-19 के दौरान X के आयात में प्रतिशत वृद्धि सभी वर्षों के X के आयात के उसके औसत से कितनी है ?
The percentage increase in import of X during 2018-19 over its Average of Import of X of all years?
(A) 50.9%
(B) 63.5%
(C) 70.6%
(D) 64.38%
Answer – D
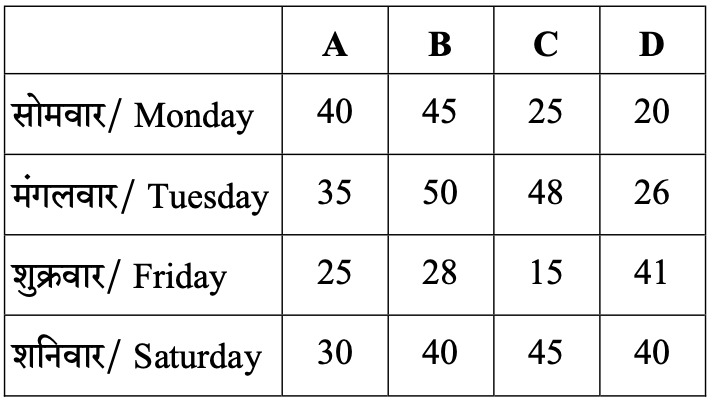
निर्देश (91-95) : दी गई तालिका/सारणी का ध्यानपूर्वक अध्ययन करें तथा नीचे दिए प्रश्नों के उत्तर दें :
Directions (91-95) : Study the table and answer the given questions. निम्न तालिका में चार व्यक्ति A, B, C तथा D सप्ताह के विभिन्न दिनों पर वस्तुओं की बिक्री कर रहे हैं :
In the following table four persons A, B, C and D are selling items on different days of the week.

मंगलवार को A द्वारा बेची गई वस्तु तथा शनिवार को C द्वारा बेची गई वस्तु का अनुपात क्या था ? What was the ratio of item sold by A on Tuesday & items sold by C on Saturday ?
(A) 9:7
(B) 7:9
(C) 6:5
(D) 8:7
Answer – B
सोमवार को D द्वारा बेची गई वस्तु, शनिवार को C द्वारा बेची गई वस्तु का कितना प्रतिशत थी ?
Items sold by D on Monday is what percent of item sold by C on Saturday ?
(A) 42.60%
(B) 49.55 %
(C) 44.44%
(D) 32.70%
Answer – C
B, C तथा D द्वारा क्रमशः सोमवार, मंगलवार तथा शनिवार को बेची गई वस्तुओं का औसत क्या है ?
What is the average of the items sold by B, C and D on Monday, Tuesday and Saturday respectively?
(A) 44.33
(B) 42.50
(C) 46.66
(D) 45.90
Answer – A
सप्ताह के सभी चार दिनों में D वस्तु की बिक्री की तुलना में B वस्तु की बिक्री में कितने प्रतिशत की वृद्धि आई ? Percent increase for selling of items B compare with Selling of items D in all four days of weeks is
(A) 29.1%
(B) 19.5%
(C) 18.3%
(D) 28.3 %
Answer – D
सोमवार को बेची गई वस्तुओं की औसत और शुक्रवार को बेची गई वस्तुओं की औसत के मध्य कितना अंतर है ? What is the difference between the average of items selling on Monday to average items selling on Friday ?
(A) 10.5
(B) 7.40
(C) 5.25
(D) 6.45
Answer – C
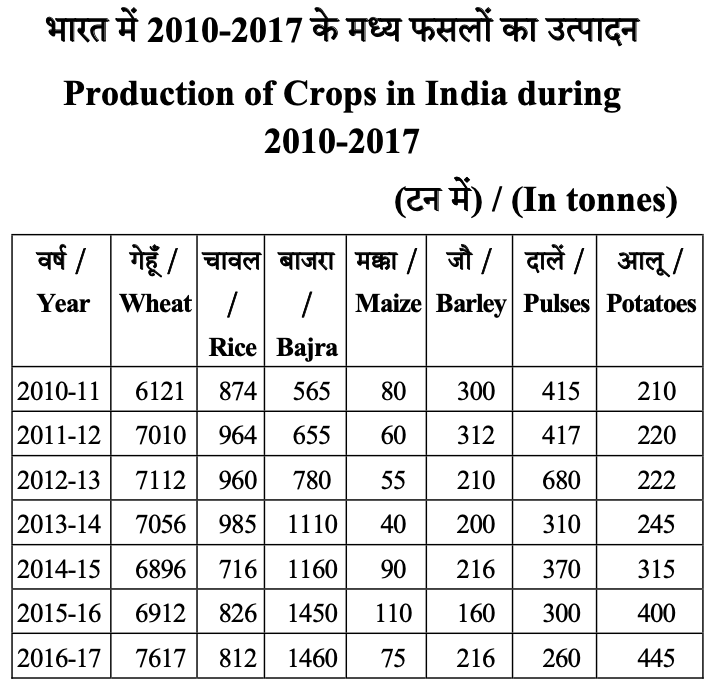
निर्देश (96-100) : दी गई तालिका/सारणी का ध्यानपूर्वक अध्ययन करें तथा नीचे दिए प्रश्नों के उत्तर दें:
Directions (96-100) : Study the table and answer the given questions.

गेहूँ उत्पादन में किस वर्ष के दौरान गिरावट दिखाई दी ?
Wheat production started showing a slump during :
(A) 2013-14
(B) 2015-16
(C) 2014-15
(D) 2016-17
Answer – A
इनमें से किस फसल में 2013-2017 के मध्य उत्पादन में लगातार वृद्धि दर्ज की गई ?
(A) मक्का
(B) जौ
(C) दालें
(D) बाजरा
Which of the following crops showed the continuous increase in production during 2013-2017 ?
(A) Maize
(B) Barley
(C) Pulses
(D) Bajra
Answer – D
2010-11 से 2016-17 की अवधि के मध्य आलू का औसत उत्पादन कितना है ?
(A) 300.00 टन
(B) 293.86 टन
(C) 353.96 टन
(D) 253.86 टन
What is the average yield of potatoes during the period 2010-11 to 2016-17 ?
(A) 300.00 tonnes
(B) 293.86 tonnes
(C) 353.96 tonnes
(D) 253.86 tonnes
Answer – B
2016-17 के मध्य इनमें से किस फसल के उत्पादन में पिछले वर्ष की तुलना में गिरावट दर्ज की गई ?
(A) जौ
(B) बाजरा
(C) चावल
(D) आलू
During 2016-17, which of the following crops showed decrease in production in comparison to the previous year?
(A) Barley
(B) Bajra
(C) Rice
(D) Potatoes
Answer – C
आलू का उत्पादन 2015-16 में 2010-11 का अंदाजन कितना गुणा है ?
The production of potatoes in 2015-16 is approximately how many times that in 2010-11 ?
(A) 1.82
(B) 2.00
(C) 2.10
(D) 1.90
Answer – D
South india ki history ke notes sir